Thermal Stratification and Seasonal Changes in Acadia’s Lakes
by EJ Holm
The turning of the seasons brings many changes to Acadia National Park, from fall foliage to snow on the carriage roads to the first buds of spring. However, one important seasonal shift is occurring out of sight of the millions of visitors that come to Acadia each year. Within the depths of Acadia’s lakes, the waters are changing from spring to summer, bringing with them new habitats and conditions for aquatic wildlife to thrive in.
What is Thermal Stratification?
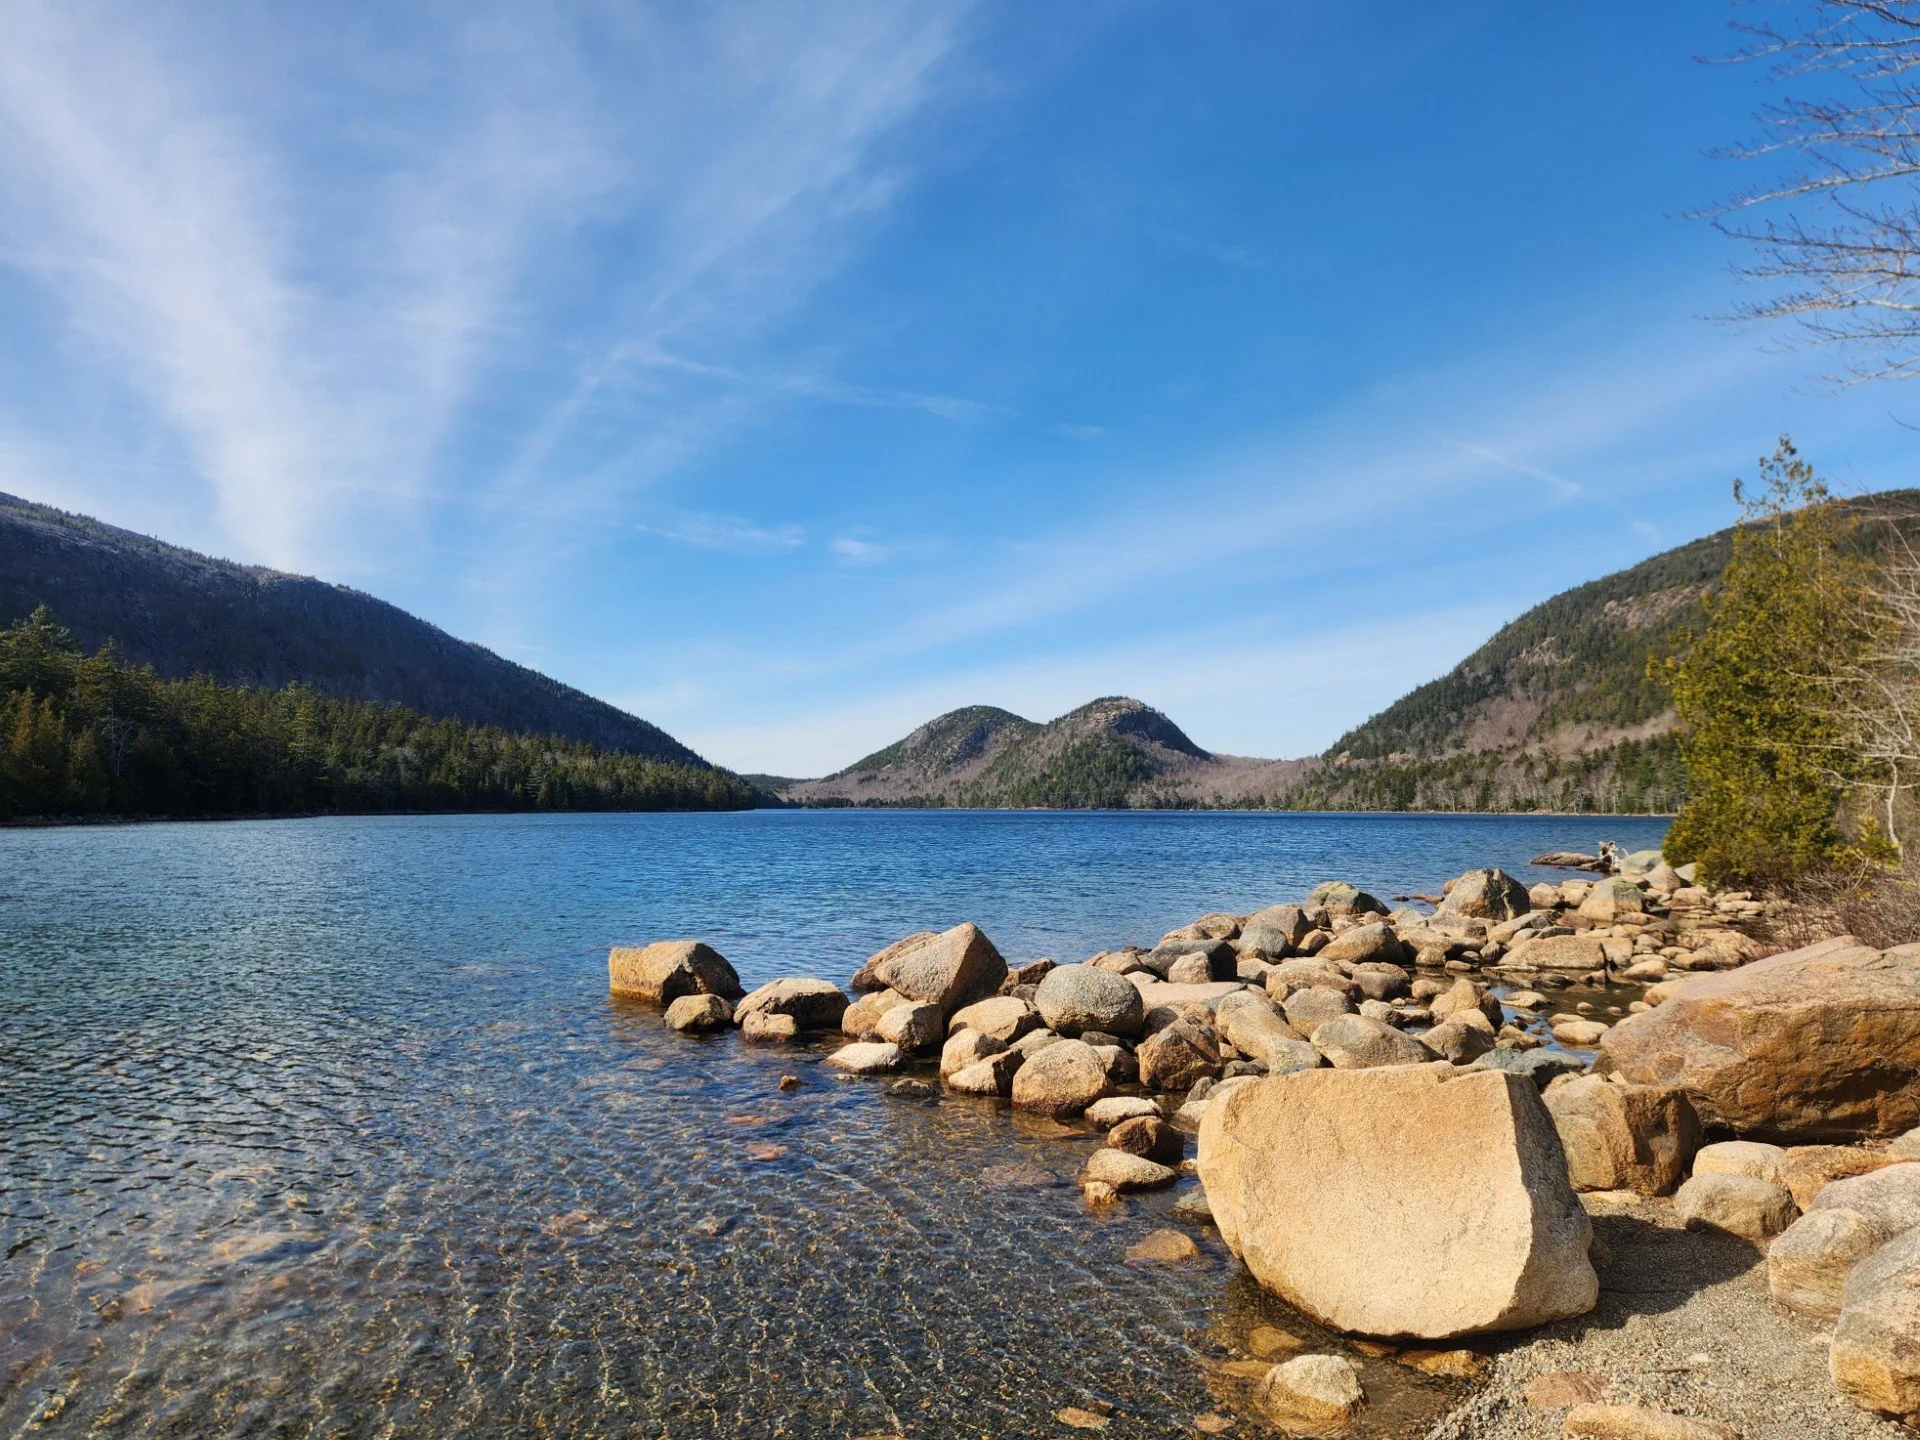
Throughout the warm summer months, the water near Jordan Pond’s surface gets heated by the sun and continually churned by wind and waves. However, the deeper parts of the lake receive less energy from the sun, and are not as affected by wind and waves, resulting in temperatures being warmer near the surface of the lake and cooler near the bottom. Furthermore, warm water is less dense than cold water. This enables the layer of warm surface water to float above a layer of cooler, denser water, with very little mixing between the two, similar to how water floats above honey in a mug of tea.
The warm layer of surface water is called the epilimnion, while the bottom layer of cold water is known as the hypolimnion. In between the two is a middle layer known as the metalimnion, which is characterized by a steep drop-off in temperature known as the thermocline.
As air temperatures begin to cool with the onset of fall and winter in Acadia, the water at the surface of Jordan Pond, in the epilimnion, cools faster than the deep water, causing it to become denser and sink to the bottom. Strong wind and currents aid in this mixing, creating a lake with roughly even temperatures throughout in a process called fall turnover. This turnover happens once more in the spring, as the lake warms up again.
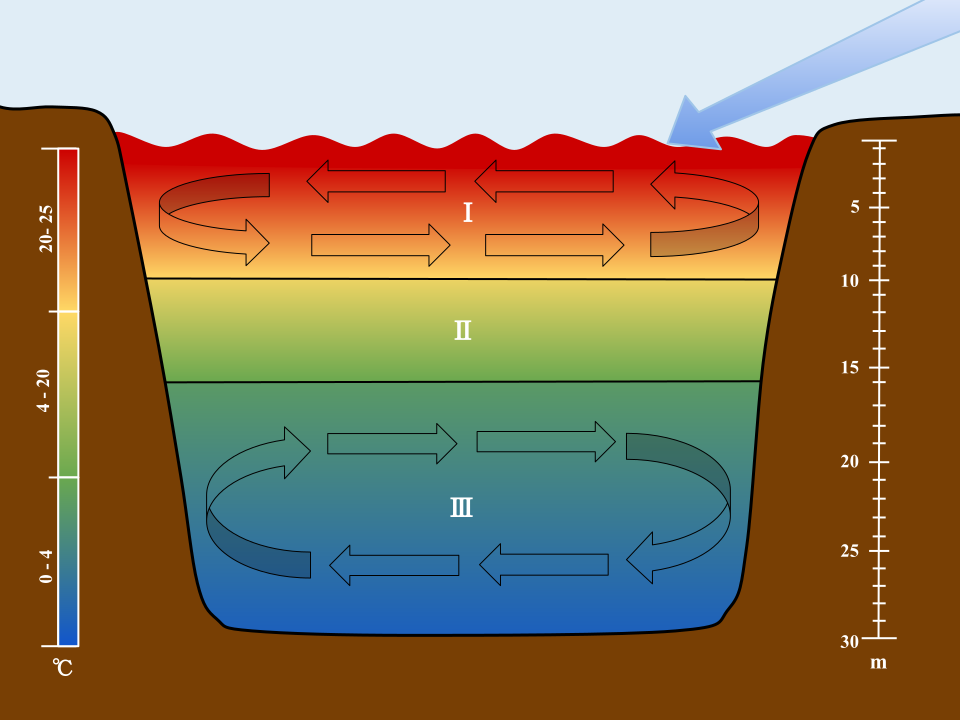
Illustration of the thermocline, showing the epilimnion (I), metalimnion (II), and hypolimnion (III). Image credit to Wikimedia Commons.
This seasonal cycle of thermal stratification can have an important effect on the ecology and wildlife populations of Acadia’s lakes. Fish species like lake trout, alewives, and the endangered American eel prefer the deeper, cooler waters of the hypolimnion, while fish like bass, crappie, and perch prefer the warm waters of the epilimnion. Thus, the stratification of Acadia’s lakes creates two separate habitats for species to live in, each of which experiences vastly different conditions and environmental pressures.
Changes to the depth of the thermocline, which marks the line between these two layers, will alter the size of these habitats, thus changing fish behavior and predation habits throughout the warm summer months. Furthermore, the depth of the thermocline affects the availability of nutrients and oxygen to organisms like bacteria and algae, which are important for maintaining a healthy ecosystem.
Jordan Pond Buoy Data
Monitoring stations like the Jordan Pond Buoy let Acadia scientists track the thermocline throughout the summer, observe changes to its depth, and monitor how the pond stratifies year over year. Temperature tracking began on April 29th this year, with the full buoy being deployed on May 7th.
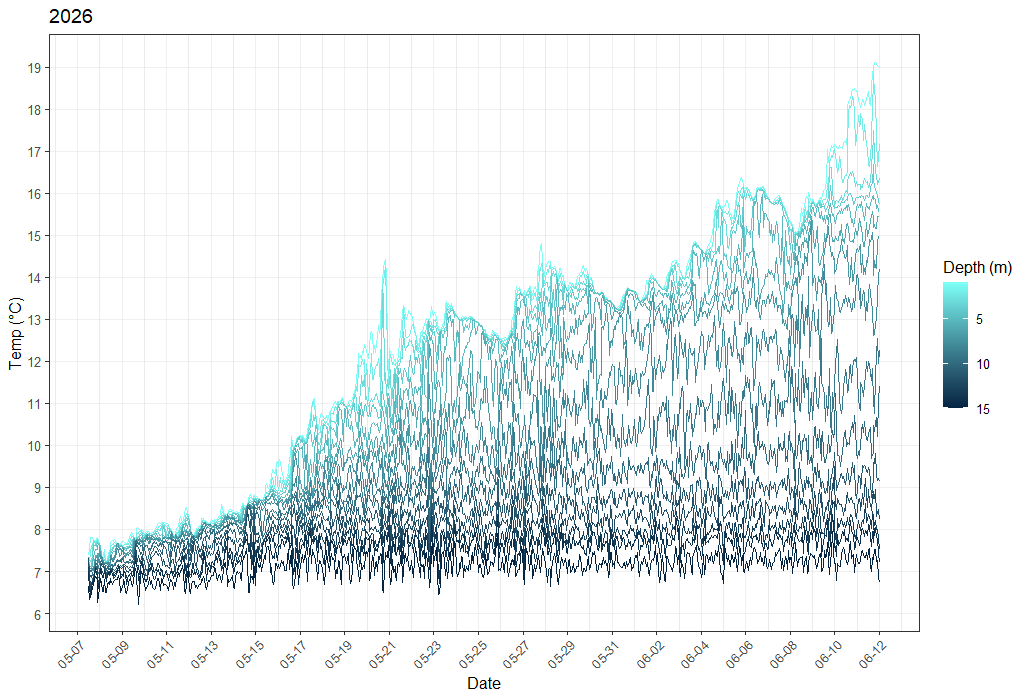
Hourly average temperatures, broken down by depth (in meters), from early May to mid-June. Darker line color indicates deeper waters.
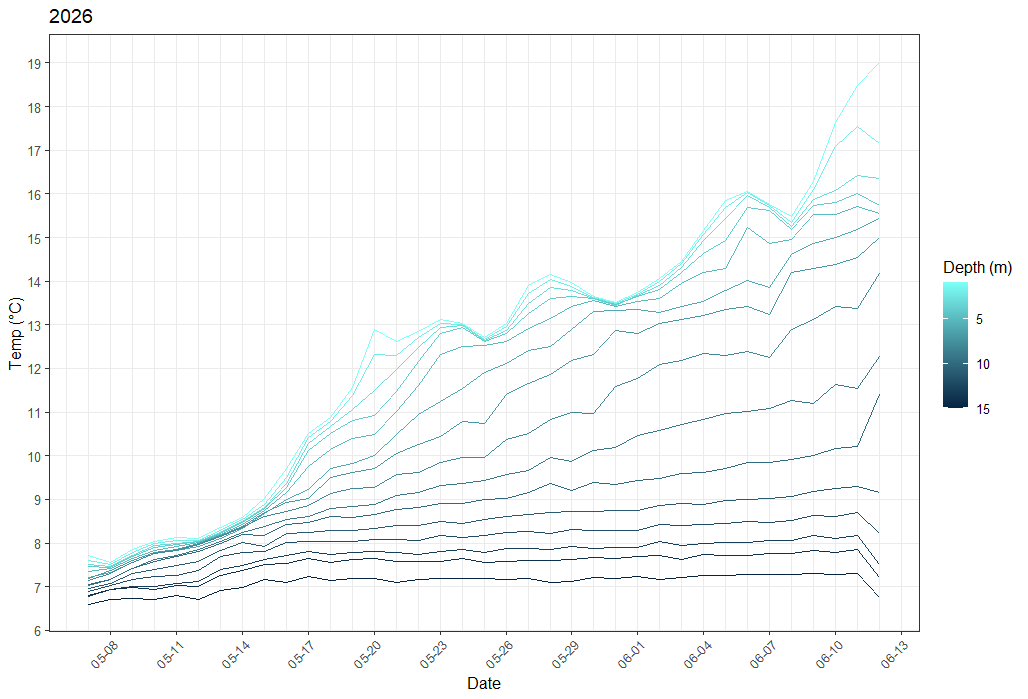
Daily average temperatures, broken down by depth (in meters), from early May to mid-June. Darker line color indicates deeper waters.
Initial data, collected over the first month and a half of sampling, shows that the lake is beginning to stratify. Surface waters are getting warmer while temperatures below 10 meters depth, where less light can penetrate, have remained largely consistent.
There is no consistent definition for the point at which a lake is considered stratified. Under the criteria of the Inter-Sectoral Impact Model Intercomparison Project (ISIMIP), a lake is considered stratified on the first day of the year that there exists a difference in water density greater than .1 kg/m^3 between the surface and bottom layers of the lake. According to this criteria, Jordan Pond began to stratify on May 19th.
However, a more useful definition for how the Jordan Pond buoy in particular collects data would be defining the onset of stratification as the first full day that exhibited a greater than 1°C difference in temperature over a 1-meter decrease in depth. Under this definition, Jordan Pond did not stratify until May 29th.
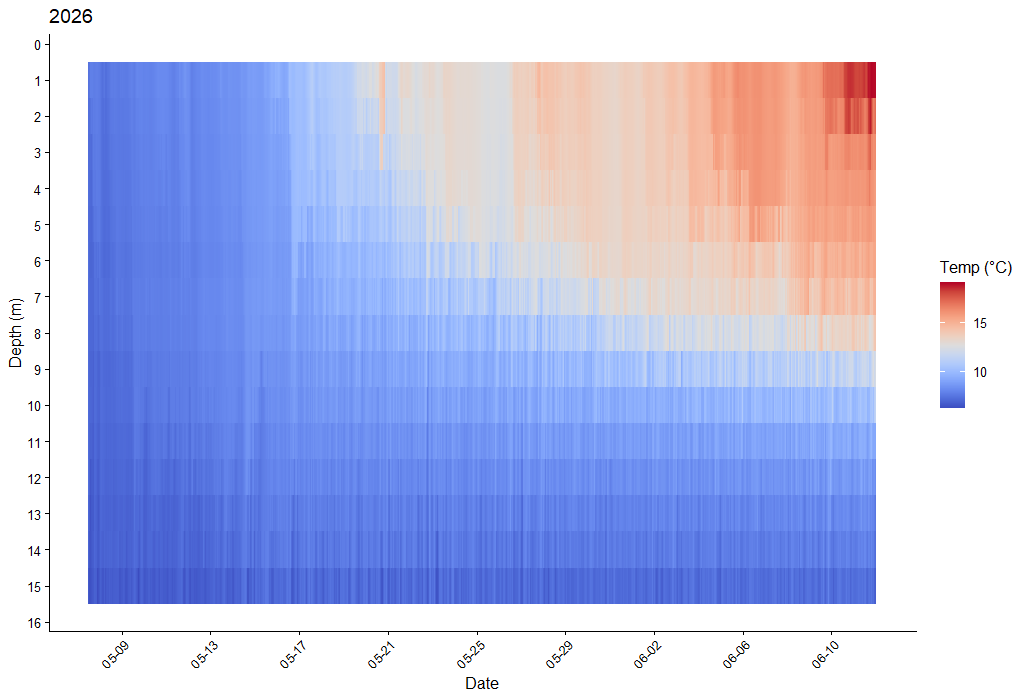
Temperature and depth profile of Jordan Pond, from early May to mid-June. Red indicates warmer waters, while blue indicates cooler waters.
Based on this data, we can also tell that Jordan Pond’s thermocline is currently located around 7-8 meters (22-26ft) in depth, which is consistent with data collected from past years. If the previous years’ trends continue to be followed, the depth of the thermocline and the difference in temperature between the two layers should increase as summer continues. Throughout July and August, the lake will get warmer and warmer, and wave action will keep circulating surface waters throughout the epilimnion. Meanwhile, the depths of Jordan Pond will remain cut off from this wave action and keep a consistently cooler temperature.
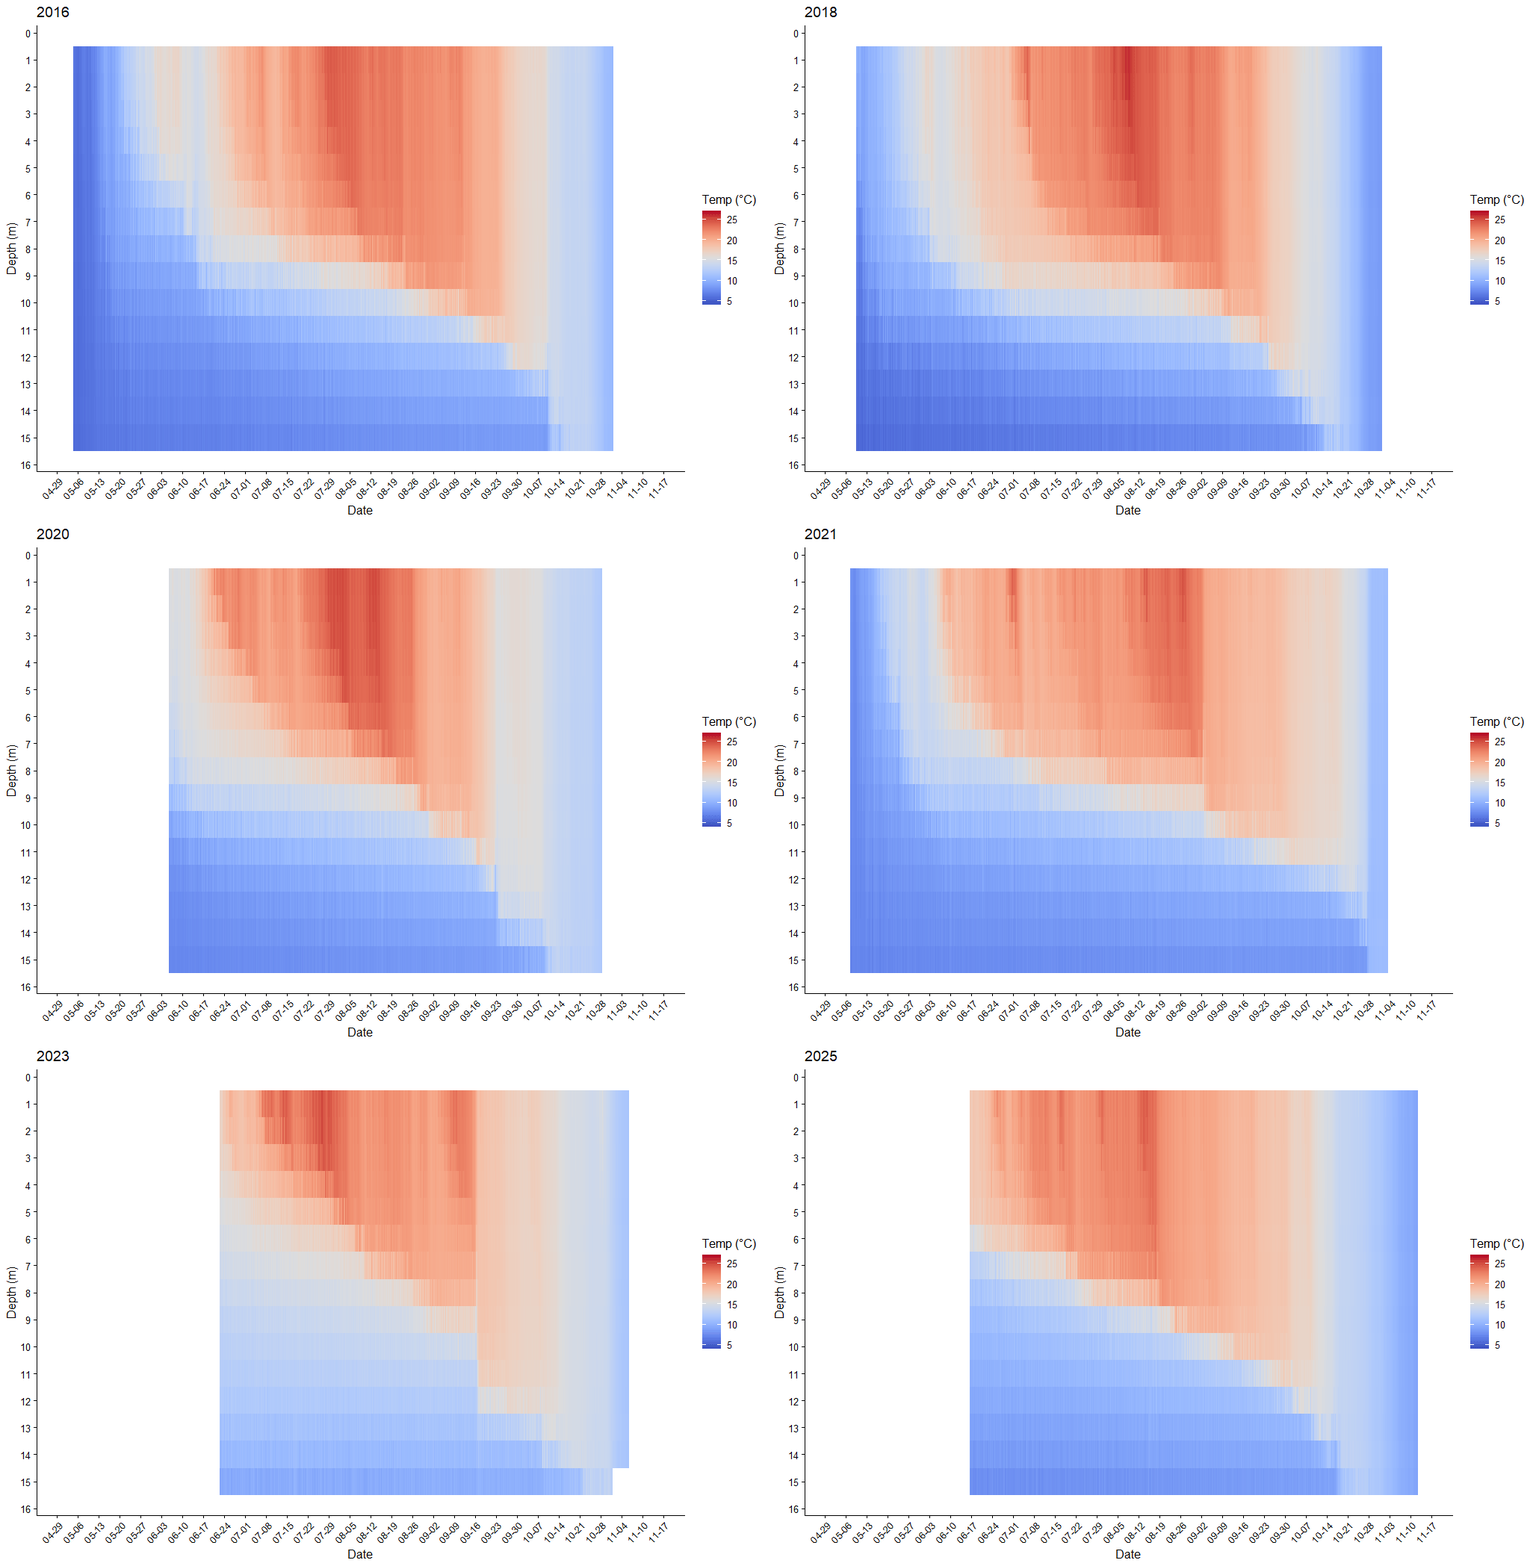
Past years’ temperature profile data for Jordan Pond, from 1 to 15 meters’ depth
For now, we will be continuing to use the Jordan Pond buoy to collect data throughout the water column and monitoring how conditions change with the onset of the summer season. Be sure to check back on this blog later for an end-of-summer update!